WHM 11 management series
1. How to check your WHM server's status and information
Several bits of useful information about your server, its hardware, and the processes currently running can be found in the Server Status section of WHM.
For details about the Apache Status & Service Status pages, watch their respective tutorials in the Services series; we won't be covering them here.
1) Let's take a look at the Server Information page.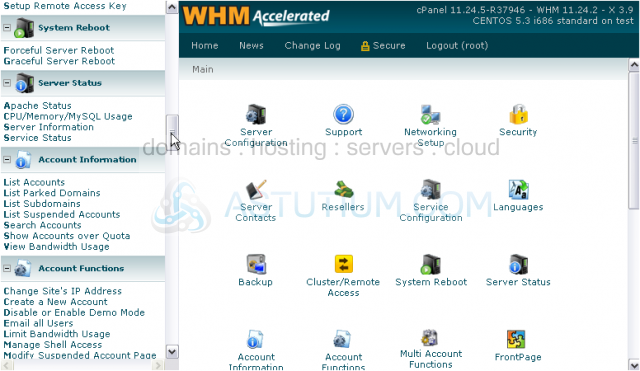
2) So we can see it better, we'll open this frame in its own tab.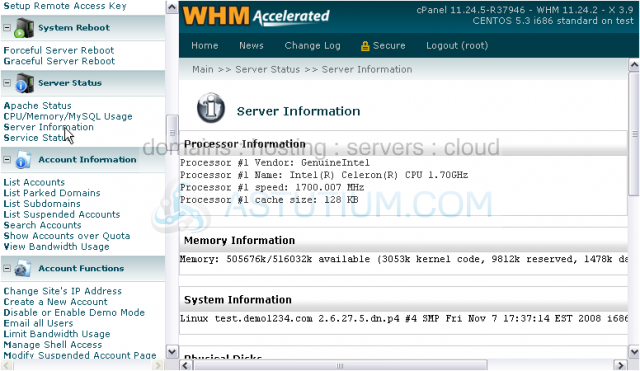
The information here is split up into six categories. We'll go over them all briefly.
First up is Processor Information. As you can see here, our server uses a 1.7 GHz Intel Celeron. If you have mulitple processors or cores, those should show up here, too. Next, Memory Information. This displays information about your server's RAM consumption. System Information lists your hostname and other information about your operating system and server.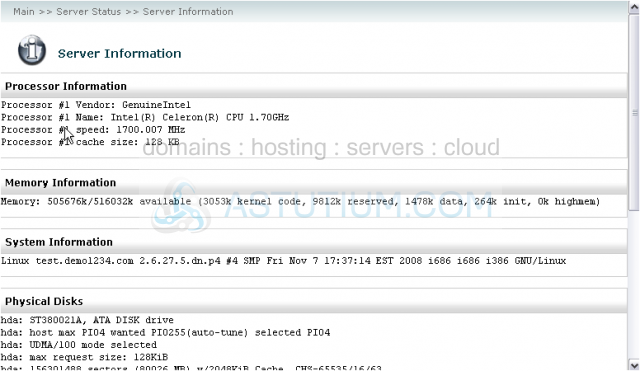
You can find information about all the hard drives on your system under Physical Disks. Current Memory Usage shows additional data about the RAM currently in use on your server.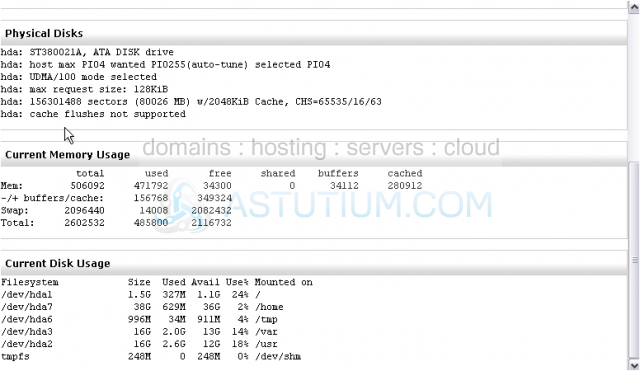
The last section on this page contains a chart of all disk partitions, their sizes, how much space is used up and available on each, and where the partitions are mounted.
3) Close this tab and return to WHM.
4) Now, we'll look over the CPU/Memory/MySQL Usage page.
This page shows the average CPU, Memory, and MySQL usage for today, split up by username.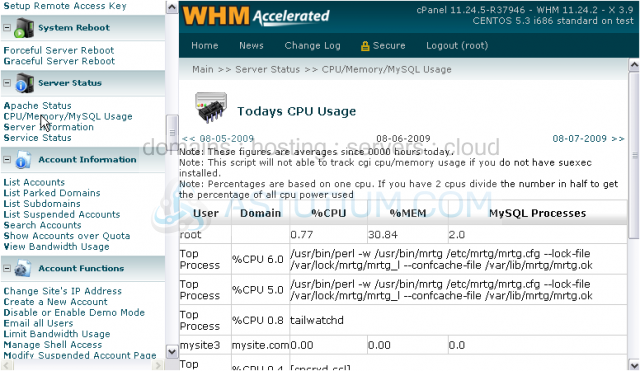
You can use the links to the left and right to reach the usage data for the previous and following days.
This is the end of the tutorial. You now know how to check your server's status and information in WHM.